Does a thin order book warn of bigger BTC moves and grid stops?
Partly. When the order book near the price is thin, the next hour's BTC move tends to be bigger, but mostly because thin books come when the market is already busy, and the last day's price moves show that just as well. A grid started on a thin book is not clearly more likely to be stopped out.
What order book depth is
The order book is the list of orders waiting to trade on an exchange: buyers below the current price (bids), sellers above it (asks). Depth here is the total size of those waiting orders within 1% of the price, bids and asks together, in USDT. A thick book takes many orders to push the price 1%; a thin book takes fewer.
Binance publishes a snapshot of depth about every 30 seconds for BTC perpetual futures. Over this period, depth within 1% was usually between 293 and 685 million USDT (10th to 90th percentile), with a median of 486 million.
Why look at it
A grid is a ladder of orders around the price that earns a small step on each dip and bounce. It loses when price runs away past the far end of its ladder; then it hits its stop and closes at a loss. If a thin book warned of bigger moves, a grid could wait, or space its orders wider, while the book is thin.
The grid here is the one from the report "What does a plain BTC grid earn before February 2026?": a buying and a selling grid side by side, steps of 0.5%, a ladder spanning 3% each way.
How it was measured
- BTC perpetual futures from Binance's public archive, 23 April 2025 to 1 February 2026. Later data is kept aside: the period from September 2026 for one decisive test, the months before it unused.
- The depth feed was frozen from 16 April to 18 May 2025 (the same numbers all day, starting a week before this window), so those days are dropped and depth starts on 19 May 2025: 6,173 hours.
- For each hour: depth from the last snapshot before the hour, and the hour's range, its high minus its low as a % of its opening price. The grid step, 0.5%, was set from the typical hourly range, so this is the move that matters to a grid.
- For each grid: depth when it started, and whether it ended in a stop. 190 grids have depth data.
- To separate "thin book" from "busy market", each hour also gets a recent range: the average hourly range over the previous 24 hours. Hours are sorted by it into calm, middle and busy thirds, and depth is compared inside each third.
- Relations are measured with rank correlation: hours are ranked by each quantity and the ranks compared, from -1 (one always goes down when the other goes up) to +1, with 0 for no relation.
A thin book comes before bigger moves
Split into five equal groups by depth, the thinnest fifth of hours was followed by a median range of 0.59%, the thickest by 0.34%. The rank correlation between depth and the next hour's range is -0.28: thinner book, bigger move.
But mostly because thin books come in busy markets
Depth and recent range go together (rank correlation -0.46): when BTC has been moving a lot, the book near the price is thin. And recent range predicts the next hour better than depth does (+0.51 against -0.28).
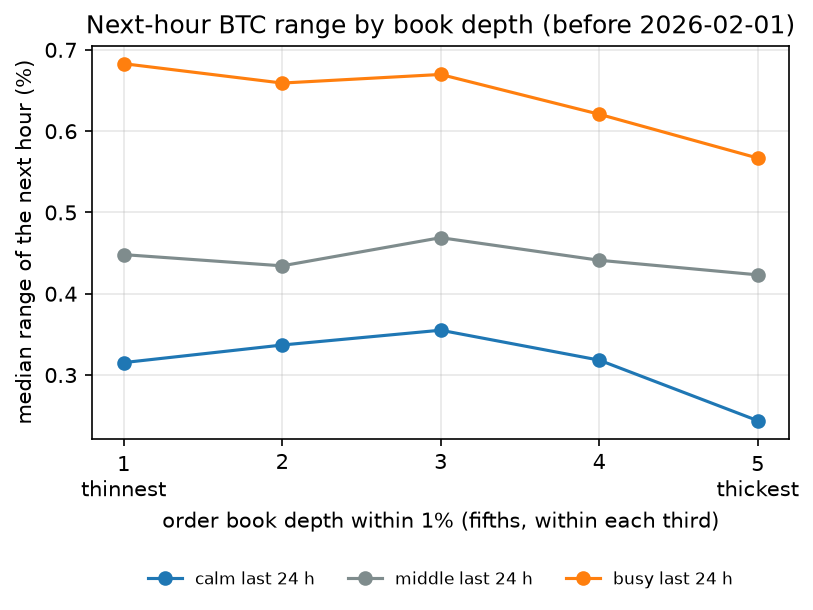
Inside each third of the market, depth still says something, but little. The rank correlation drops to between -0.04 and -0.13. Most of what remains is that the thickest books come before quieter hours (in calm markets 0.24% against 0.32% for the thinnest; in busy markets 0.57% against 0.68%), not that the thinnest books come before wilder ones.
Thirds are a coarse way to hold the market fixed, so one more check was added after these results: removing recent range's straight-line relation from both ranks, depth's remaining correlation with the next hour's range is -0.05. Depth adds almost nothing that recent range does not already say.
Grids started on a thin book are not clearly stopped out more
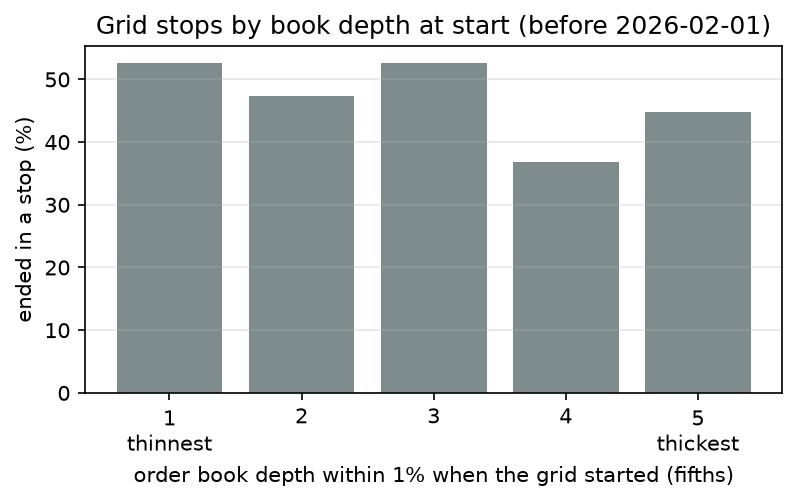
Grids started in the thinnest fifth of depth were stopped out 53% of the time, against 45% for the rest: 7 percentage points more, but the 95% confidence interval runs from -9 to +25, and the five groups go up and down with no order (37% to 53%). With 38 grids per group, that is about as much as chance would move them. Whether a grid was buying or selling mattered more: buying grids in the second and third fifths were stopped out about two times in three, selling grids in the same fifths less than half the time. That points to the trend, not the book, deciding which side gets stopped out (not tested here).
What it means
Order book depth mostly repeats what recent price moves already show. For a grid, waiting while the book is thin has no support here, and that idea was dropped.
One lead remains, and it is about price, not depth: recent range predicts the next hour's range well. A grid whose step widens in busy markets and narrows in calm ones would keep its steps matched to how far price actually moves. That is recorded as the next idea, but with a warning: a check added after the results shows the fixed-step grid is not stopped out more in busy markets (41% to 51% across fifths of recent range, no order), so any gain would have to come from fills and round trips, not from fewer stops. It would be set on data before February 2026 and tested once on September to October 2026, data no report has touched.
Limits
- One band (within 1%) and one moment (the last snapshot before the hour). Depth further from the price, or the balance between bids and asks, was not looked at here.
- Depth is in USDT, so it also grows with BTC's price.
- About 190 grids with depth data, 38 per group, can only show a large effect on stops.
- Neighbouring hours and neighbouring grids are not independent; the intervals treat them as if they were, so they are, if anything, too narrow.