Does adding a positioning portfolio to LB6 make it better?
No. Splitting the capital half and half between LB6 and a portfolio of rules on futures positioning data made +34% instead of LB6's +40%, and fell deeper (1.8 points instead of 1.4). Efficiency dropped from 28.0 to 18.9. The positioning portfolio is far weaker than LB6 on the same months, and on this short a stretch it is no better than what the same search finds in scrambled data.
The two parts
LB6 is PekkaLabs's BTC system: six rules ("engines") that read hourly options-market data, three going long and three short. Here each engine gets a sixth of the capital, using its simulated trades from 23 April 2025 to 24 August 2026, valued hour by hour.
The positioning portfolio is six rules on public data about how BTC futures traders are positioned (funding rate, open interest, the long/short account ratio, the share of aggressive buying, and changes in these), found the way LB6's engines were found: by trying 29,160 two-measure rules and keeping the best three long and three short, each on a different pair of measures. Both were searched and scored on the same months, LB6 by pak Yon and the positioning rules here.
Results
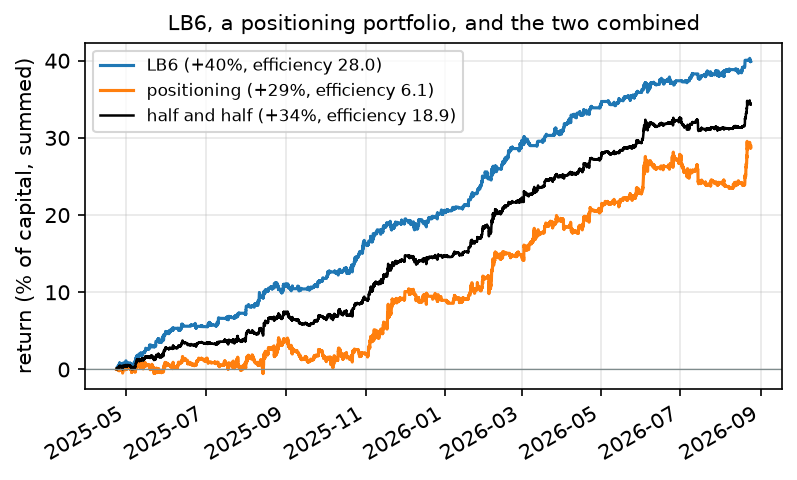
| April 2025 to August 2026 | return | worst fall | efficiency (return / worst fall) |
|---|---|---|---|
| LB6 alone | +39.9% | 1.4 points | 28.0 |
| positioning portfolio alone | +28.8% | 4.7 points | 6.1 |
| half LB6, half positioning | +34.4% | 1.8 points | 18.9 |
| holding BTC | -7.9% | 69.4 points | -0.1 |
Returns are hourly moves added up, not compounded; points are percentage points of capital.
The two move somewhat together (daily correlation +0.28), and the positioning portfolio falls more than three times deeper than LB6. Adding it lowers LB6's return and raises its worst fall, so the mix is worse on both counts. About 5 of the positioning portfolio's 29 points came in its last ten days.
A smaller share was also tried after the result, outside the locked bet:
| positioning share of capital | return | worst fall | efficiency |
|---|---|---|---|
| 0% (LB6 alone) | +39.9% | 1.4 points | 28.0 |
| 10% | +38.8% | 1.3 points | 29.3 |
| 20% | +37.7% | 1.3 points | 29.6 |
| 30% | +36.6% | 1.4 points | 26.0 |
| 50% | +34.4% | 1.8 points | 18.9 |
A tenth or a fifth of the capital in positioning lowers the worst fall slightly and nudges efficiency up by about 1.5. That is the ordinary effect of mixing in any second stream that made money over the same months and does not move closely with LB6; given the next section, it says little about positioning data itself.
The positioning portfolio is not clearly better than chance here
Running the same search on scrambled data (each measure shifted in time by a month or more against BTC's price, so it no longer lines up with it) gave portfolios with an efficiency between 7.1 and 14.4 in ten runs, 10.5 in the middle. The real portfolio scored 6.1, below all ten. Over 16 months, picking the best of 29,160 rules produces this much on any data; the positioning rules add nothing visible on top.
On the longer 2020 to 2024 search ("Does a positioning portfolio of three long and three short rules beat holding BTC from 2025?") the real portfolio beat 9 of its 10 scrambled versions, and held a small gain in 2025-2026. Sixteen months is too short for this kind of search to separate signal from luck.
What it means
- LB6 should not be diluted with this positioning portfolio.
- On the same data and the same footing (both searched and scored on the same months), options data as LB6 uses it is far more informative than public futures positioning data.
- In-sample results on short windows need the scrambled-data comparison next to them: here it shows the positioning score is what the search alone produces.
Limits
- One window (16 months), one way of combining (half and half), one positioning portfolio.
- LB6's numbers are also in-sample: its rules were chosen by pak Yon on data that includes this window, and how many rules he tried is not recorded here, so the two searches are alike in kind but not shown to be alike in size.
- Shifting the measures in time keeps each one's own ups and downs; it removes only their timing against BTC's price.