Does order flow when a grid starts warn that it will be stopped out?
No warning showed up on the data so far, but the data can only rule out a large one. Grids started while order flow ran against them were stopped out a little more often than grids started with the flow: 50% against 45% for buying grids, 48% against 44% for selling grids. Gaps that small could easily be chance with about a hundred grids per side.
What a grid is, and how it loses
A grid places a ladder of orders around the current price. A buying grid buys on each dip and sells one step higher on the bounce; a selling grid does the mirror. Each grid runs until price leaves its ladder. If price leaves on the profitable side, the grid closes with a gain. If price runs the other way, past the far end of the ladder, the grid hits its stop: it closes everything it holds at a loss. A new grid then starts at the current price.
The grid here is the same one as in the report "What does a plain BTC grid earn before February 2026?": a buying grid and a selling grid side by side, 500 USDT each, steps of 0.5%, a ladder spanning 3% each way.
What order flow is
Every trade on an exchange has a side that waits and a side that crosses the spread to trade at once. The crossing side is the taker. Binance publishes, for every minute, how much of the volume was bought by takers. The taker-buy share of an hour is the part of the hour's volume that takers bought: 0.5 means aggressive buying and selling were equal, above 0.5 buyers dominated, below 0.5 sellers did.
Why look at it
Stops are where a grid loses its money. A stop happens when price runs one way, and runs often start with one side trading aggressively. If flow at the moment a grid starts warned of a run, a grid could simply wait for calmer flow before starting.
A buying grid is started against flow if sellers dominated the hour before it started; a selling grid is against flow if buyers dominated. Otherwise it is started with flow.
How it was measured
- BTC perpetual futures, minute by minute, from Binance's public archive, 23 April 2025 to 1 February 2026. Later data is kept aside for decisive tests, so that no choice made here is tuned to it.
- Each grid from start to end counts once: 103 buying grids and 103 selling grids. The grid still running when the data ends is left out.
- Flow is the taker-buy share of the 60 minutes before the grid started. One hour, because one grid step (0.5%) was chosen as BTC's typical move in an hour.
- For each grid: did it end in a stop, and what did it make or lose, in USDT on its 500 USDT, after fees.
- Differences in stop rates are in percentage points (pp): 50% against 45% is a difference of 5 pp.
Grids started against flow are stopped out slightly more often
| buying grids | selling grids | |
|---|---|---|
| stopped out, with flow | 45% of 49 | 44% of 61 |
| stopped out, against flow | 50% of 54 | 48% of 42 |
| difference | +5 pp (could be -15 to +25) | +3 pp (could be -15 to +24) |
| average result, with flow | +0.08 USDT | +0.43 USDT |
| average result, against flow | -1.00 USDT | 0.00 USDT |
The ranges in brackets are 95% confidence intervals: how far the difference moves when the grids are resampled. Both are wide and include zero. Grids started against flow also made less on average, but that gap's range includes zero too (buying grids -1.08 USDT, from -3.90 to +1.49; selling grids -0.44 USDT, from -3.14 to +2.35).
Stops do not climb steadily as flow gets more one-sided
If flow warned of runs, stops would climb steadily as flow gets more lopsided against the grid. Against flow is on the left of the chart for buying grids (most selling) and on the right for selling grids (most buying).
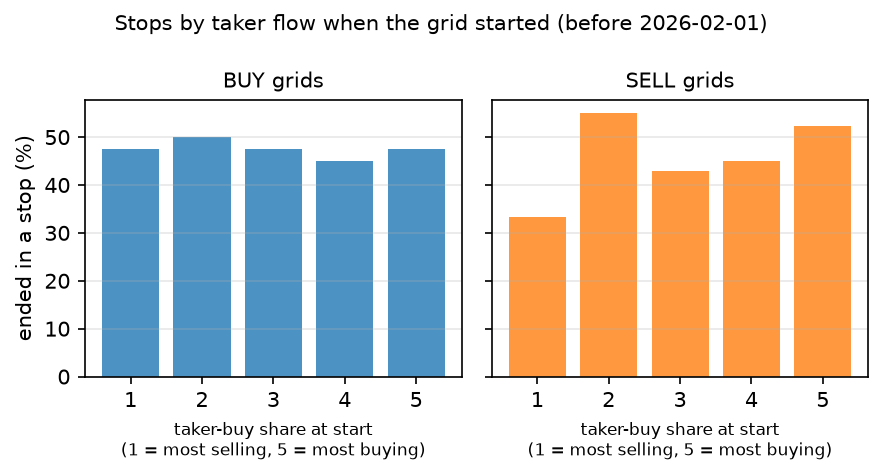
Grids are sorted into five equal groups of about 20 by the taker-buy share when they started. Buying grids are stopped out 45% to 50% of the time in every group: flat. Selling grids are stopped out least when sellers dominated most (33%) and more when buyers dominated most (52%), which is the direction the idea predicts; but the second group (55%) breaks the order. With 20 grids and a stop rate near 46%, one group's rate typically moves by about 11 points either way by chance alone, so this panel can neither confirm nor rule out the idea.
What it means
There is no clear sign that order flow in the hour before a grid starts separates grids that will be stopped out from grids that will not. This is weak evidence, not proof: the ranges above rule out only differences of about 20 points or more. The idea "wait for balanced flow before starting a grid" was dropped rather than tested, because nothing here gives a reason to expect it to work, and because the only data kept aside for grids was already used once, by the test of a grid that follows LB6. A new grid test on it would no longer be blind.
The report "Does order flow before an LB6 entry say anything about how the trade will go?" found the same for LB6's trades.
Limits
- One window (60 minutes) and one flow measure. A shorter window, flow measured as a change, or flow during the grid's life (rather than at its start) were not looked at. Flow during a run is one-sided almost by definition, so it would only help if it could be seen early enough to act on.
- Grids are a model of Hummingbot's grid executor on minute bars, not the executor itself.
- A new grid starts the minute the previous one ends, so the hour before a start is often the run that just stopped the previous grid, and neighbouring grids are not independent. The confidence intervals treat them as independent, so they are, if anything, too narrow.
- About 100 grids per side is few: a real difference of 5 to 10 points in stop share would need several times more grids to show.